Indicators of the Long term vision 2030 (LTV) for the Scheldt estuary
Indicators are being used more and more as an instrument for exploring, planning, implementing and evaluating policy. Furthermore they are very useful as link between policy and scientific research. In the context of the LTV objectives, this project was launched in 2010 to select a set of indicators and to adjust them to the different levels of use of the Scheldt estuary. The result of this project was a final publication, consisting of 18 indicators, that is freely available. In the short term, ScheldeMonitor aspires to update this publication with data of the past decade.
A summary of each indicator is available further on this page. However, both the report and other related documents are only available in dutch.
Vision
The development of this set of indicators was part of the Long Term Vision Research and Monitoring (O&M) program, within the function 'Naturalness'. More information about the objectives, perspectives and building blocks of the project can be found in the vision document and the literature study.
Demographic pressure
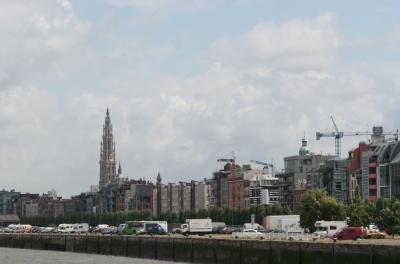
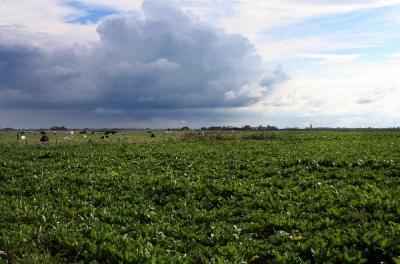
Since 1990, the number of inhabitants in the municipalities along the Scheldt estuary increased by 5.4% to almost 2 million in 2008. In the last decade, both in the Flemish and the Dutch Scheldt municipalities, mainly agricultural land was lost in favour of other land uses such as infrastructure. In 2009, 14% of the total area of the Scheldt municipalities was built up, an increase of 1.7% compared to 1996 - 1997. The average income of an inhabitant in the Flemish or Dutch municipalities in 2007 was lower than the average income of an inhabitant in respectively the Flemish region or the Netherlands.
| MEASUREMENT | TECHNICAL SHEET | DATA PROVIDER |
|---|---|---|
| Number and density of the population in the Scheldt municipalities |
Bestand
|
Algemene Directie Statistiek en Economische Informatie |
| Land use and built-up area in the Scheldt municipalities |
Bestand
|
Administratie van het kadaster |
| Welfare index in the Scheldt municipalities |
Bestand
|
Algemene Directie Statistiek en Economische Informatie |
Socio-economic importance of the ports
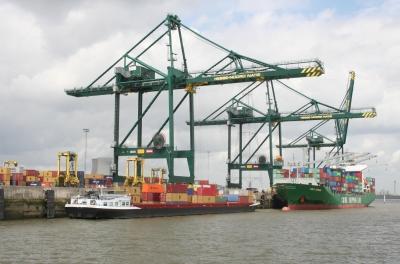
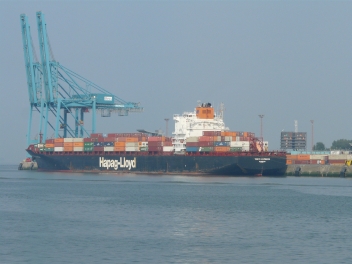 The Scheldt ports have an important gate function and a socio-economic influence in the region. The freight transhipment in the Scheldt ports increased from 113 million tons in 1980 to 250 million tons in 2008, an absolute record. Especially the container flow in the port of Antwerp experienced a sharp increase. The Scheldt ports are the strongest growing ports in the 'Hamburg - Le Havre' range since 1980 and account for more than 20% of the total cargo transshipment in the area. In 2007, the total employment in the ports has increased with a minimum of 5% (Terneuzen) and a maximum of 22% (Antwerp) compared to 2002. The total added value has known a strong growth compared to 2002: +57% for Vlissingen and Terneuzen and respectively +43% and +31% for Antwerp and Ghent.
| MEASUREMENT | TECHNICAL SHEET | DATA PROVIDER |
|---|---|---|
| Cargo transshipment in the Scheldt ports |
Bestand
|
Vlaamse Havencommissie |
| Added value of the Scheldt ports |
Bestand
|
|
| Employment in the Scheldt ports |
Bestand
|
Buck Consultants International Nationale Bank van België |
Nautical management
When the final publication was made available in 2011, no chapter for nautical management had been included yet. At the end of June 2011 two reports would be evaluated by the Permanent Committee on the Supervision of the Scheldt (PC):
- The update of the evaluation 'external safety'
- The final results of the chain operation study
However, the summarizing texts that would be provided by the PC afterwards were not yet included in the indicators.
Bottom disturbing activities
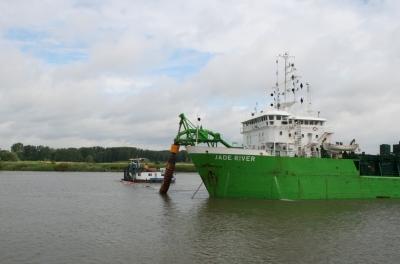
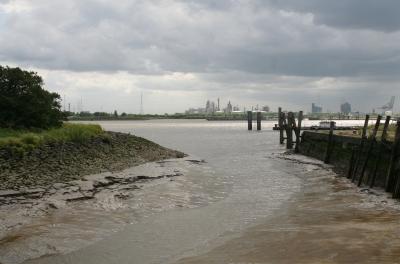
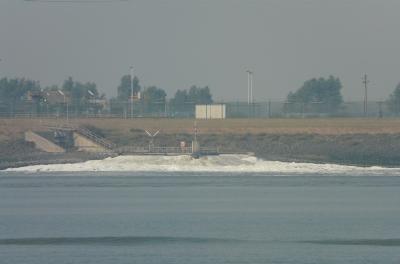
The annual volumes of dredged and dumped material reached maximal values to 17 million m3 during the first and second widening of the Scheldt estuary. After the second expansion, an average of 9.7 million m3 was dredged every year. In the entire period (1931 - 2008), 116 million m3 more was dredged than was dumped back in the estuary. Until 1970 a lot of dredge spoil was used for the construction of the new port and industrial sites. Since 1956, 154 million m3 of sand has been extracted in the Scheldt estuary. Since 1993 sand extraction in the Western Scheldt had reached its maximum of 2.6 million m3 and was discontinued from 2014 onwards. An average of 1.1 million m3 of sand was extracted in the Sea Scheldt between 1981 and 2008. The cost of dredging activities for maintenance in the Scheldt estuary is minimal compared to the added value realized by the Scheldt ports.
| MEASUREMENT | TECHNICAL SHEET | DATA PROVIDER |
|---|---|---|
| Dredging and dumping volumes in the Scheldt estuary depending on location |
Bestand
|
Afdeling Maritieme Toegang |
| Cost of dredging activities for maintenance in the Scheldt estuary |
Bestand
|
Afdeling Maritieme Toegang |
| Volume extracted sand in the Scheldt estuary depending on location |
Bestand
|
Afdeling Maritieme Toegang Rijkswaterstaat, Dienst Zeeland |
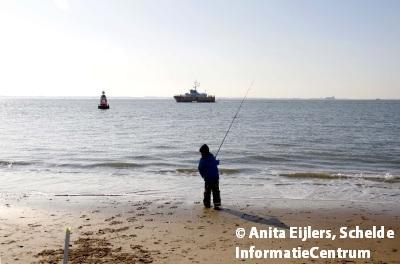
Recreation on land and on water
When the final publication was made available in 2011, no chapter for recreation on land and on water had been included yet.
Socio-economic importance of residential tourism
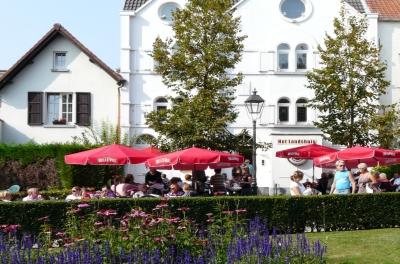
The number of nights spent by Dutch tourists in the tourist regions of Zeeuws-Vlaanderen and Walcheren is decreased to 17% since 2005. In the Bevelanden and in Tholen, residential tourism is rather increasing. However, no data are available for residential tourism specifically for the Western Scheldt. Between 2002 and 2008, the number of holidays and the number of nights spent in the touristic region 'Scheldeland' in Flanders grew by 50% and 40% respectively. The average duration of a stay slightly decreased from 2.6 to 2.3 nights. During a holiday, a tourist spends on average 68 euros a day in the region Scheldeland compared to 23 euros in the Zeelandic regions. The expenses are partly determined by the type of accommodation on offer. Determination of a trend in the expenditure is currently not possible. There is growing attention for eco-labels in tourist infrastructure, although the portion of the total offer is still limited.
| MEASUREMENT | TECHNICAL SHEET | DATA PROVIDER |
|---|---|---|
| Number of arrivals, nights spent and expenditure in residential tourism |
|
Kenniscentrum (Kust)toerisme (Zeeland) Scheldeland vzw SteR (K.U.Leuven) Toerisme Vlaanderen |
|
Number of accommodations, marinas and recreational beaches recognized by an international eco-label |
Bestand
|
Bond Beter Leefmilieu Stichting Keurmerk Milieu, Veiligheid en Kwaliteit |
Maintenance of morphology and dynamics
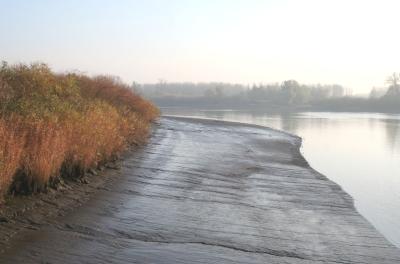
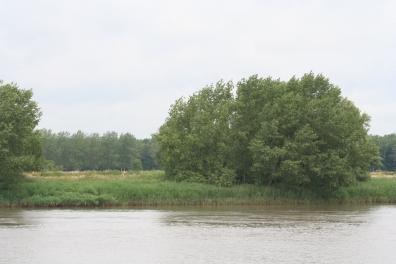
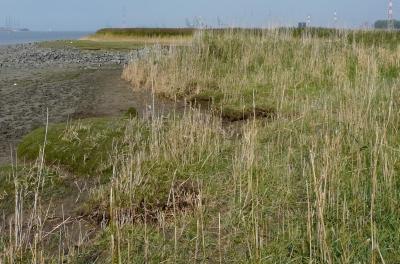
The different habitats (ecotopes) in the Scheldt estuary have endured major changes in the last 50 years. In 2004, the mudflat (and plane) area in the Western Scheldt and Lower Sea Scheldt decreased with 20% compared to the 1950's, a loss of more than 1,000 ha. The salt marsh area was in 2004 two thirds of the area in the 50's, a decrease of approximately 1,500 ha. In the same period, the area of the subtidal or underwater habitats increased with 325 ha. On average, the gullies of the Western Scheldt have deepened and/or widened between 1951 and 2002. Since 1988, the mean high water levels in the Scheldt estuary show an upward trend. The location of the maximum average high water level and the minimum average low water level have shifted upstream since 1988. Developments in the salinity or salt gradient are hard to interpret and deserve further investigation.
| MEASUREMENT | TECHNICAL SHEET | DATA PROVIDER |
|---|---|---|
|
Development of the ecotopes in the Scheldt estuary |
Bestand
|
ALKYON Hydraulic Consultancy & Research |
|
Development of the channel system in the Western Scheldt |
Bestand
|
|
| Water levels and tidal asymmetry in the Scheldt estuary |
Bestand
|
Rijkswaterstaat Waterbouwkundig laboratorium |
| Salinity gradient in the Scheldt estuary |
Bestand
|
Centrum voor Estuariene en Mariene Ecologie Rijkswaterstaat Universiteit Antwerpen Vlaamse milieumaatschappij Waterbouwkundig laboratorium |
Safety against inundation
Since 1988, the mean high water levels in the Scheldt estuary show an upward trend. The evolution of the mean low water levels is less clear. The location of the maximum average high water level and the minimum average low water level have shifted upstream since 1988. The number of storm floods at Vlissingen and Antwerp have increased in the period 1950 - 2000. In 2005, the floodrisk in the dike ring areas along the Western Scheldt, both in terms of number of victims and economic value, decreased compared to 1975. In the Sea Scheldt basin, the inundation risk (damage) amounts to approximately 1 billion euros per year (situation in 2006).
| MEASUREMENT | TECHNICAL SHEET | DATA PROVIDER |
|---|---|---|
|
Inundation risks along the Scheldt estuary |
Bestand
|
Deltares Rijkswaterstaat Waterbouwkundig laboratorium |
|
Water levels and tidal asymmetry in the Scheldt estuary |
Bestand
|
Helpdesk Water, Rijkswaterstaat |
Quality of surface water
Overall, the quality of the surface water in the Scheldt estuary scores insufficiently according to the assessment of the European Water Framework Directive. In 2009, no surface water body in the Scheldt estuary was in an acceptable environmental or ecological condition. Concerning the chemical state, the amount of metals, industrial pollutants and pesticides meet the standards in more than 60% of the water bodies. Often other pollutants are the problem. Most of the water bodies also score insufficient when assessing the ecological quality elements of the directive (algae, other aquatic flora, benthic invertebrates, fish, physicochemical parameters and specific pollutants). The fish stock of the estuary is in a moderate to poor condition. However, the oxygen balance has improved considerably in the last decades.
| MEASUREMENT | TECHNICAL SHEET | DATA PROVIDER |
|---|---|---|
|
Chemical state of the surface waters in the Scheldt estuary |
Bestand
|
Rijkswaterstaat Vlaamse milieumaatschappij |
|
Ecological state/potential of the surface waters in the Scheldt estuary |
Bestand
|
|
|
State of the fish stock in the Scheldt estuary |
Bestand
|
Instituut voor Natuur- en Bosonderzoek Rijkswaterstaat |
|
Oxygen balance in the Scheldt estuary |
Bestand
|
Centrum voor Estuariene en Mariene Ecologie OMES Rijkswaterstaat Vlaamse milieumaatschappij |
Environmental impact of ports and shipping
The efforts of the maritime sector to disconnect the environmental pressure from the growth in this sector are noticeable. The emissions of sulphur oxides, particulate matter and nitrogen oxides in the Scheldt ports have decreased relatively compared to the (rising) cargo transshipment, and in some cases even decreased in absolute values. The stricter emission standards, the use of low-sulphur fuel and the renewal of ship's engines definitely have an impact. There also appear to be a break in the trend in CO2 emissions, which are rising less rapidly compared to cargo transshipment. The Scheldt ports aim at more environmentally friendly ways of freight transport from and to the hinterland. Figures will be made available that can show trends in the general modal distribution of the freight transport.
| MEASUREMENT | TECHNICAL SHEET | DATA PROVIDER |
|---|---|---|
|
Emissions of ports and shipping in the Scheldt estuary |
Bestand
|
Emissieregistratie Nederland TNO Vlaamse milieumaatschappij |
|
Modal distribution of the freight transport from the Scheldt ports via the hinterland connections |
Bestand
|
Gemeentelijk Havenbedrijf Antwerpen |
Impact of pollutants
In recent decades, consumers, industry, agriculture, transport, traffic and other sectors have made big efforts to tackle the impact of environmental pollutants such as heavy metals, pesticides and nutrients on the Scheldt estuary. In general, the nutrient load (nitrogen and phosphorus compounds) in the Scheldt basin in Flanders and the Netherlands has decreased in the past 20 years. In 2009, 95% of the designated bathing waters in the Scheldt estuary met the European minimum standards for bathing water quality. The proportion of 'heavily polluted' sediments in the Flemisch part of the Scheldt estuary decreased from 70% to 54% between 2000 and 2007. In 2009, all samples of dredged material in the Western Scheldt met the quality standards. The measured levels of pollutants in the food web of the Scheldt estuary have declined in the past decades.
| MEASUREMENT | TECHNICAL SHEET | DATA PROVIDER |
|---|---|---|
|
Discharge of nutrients to surface water in the Scheldt estuary |
Bestand
|
Emissieregistratie Nederland Vlaamse milieumaatschappij |
|
Pollutants in the food web of the Scheldt estuary |
|
|
|
Sediment quality in the Scheldt estuary |
Bestand
|
Vlaamse milieumaatschappij |
|
Bathing water quality in the Scheldt estuary |
Bestand
|
Europees Milieuagentschap |
Status of species and habitats
Only 4 out of 30 (or 13%) species and habitats in the Natura 2000 areas of the Scheldt estuary have a favourable conservation status on the level of the wider biogeographical regions. On the level of the area, the status of species and habitats is provisionally assessed according to the 'protection status'. All species of the Habitat Directive in the areas 'Scheldt and Durme estuary' and 'Vlakte van de Raan' have a good or excellent protection status. Three of five species in 'Western Scheldt and Saeftinghe' have a good protection status. The status of the great crested newt (Triturus cristatus) in 'Zwin and Kievittepolder' is moderately or less well preserved. Almost all bird species, designated for the Bird Directive areas of the Scheldt estuary, have a well of excellently preserved protection status. The number of breeding pairs and the breeding success of coastal breeding birds in the Scheldt estuary often show an erratic trend. Many environmental variables (for example weather conditions, predation, vegetation present) have an influence.
| MEASUREMENT | TECHNICAL SHEET | DATA PROVIDER |
|---|---|---|
|
Conservation status of habitats of the Habitat Directive in the Scheldt estuary |
Bestand
|
Instituut voor Natuur- en Bosonderzoek Ministerie van Landbouw, Natuur en Voedselkwaliteit |
|
Conservation status of species of the Habitat Directive in the Scheldt estuary |
Bestand
|
Instituut voor Natuur- en Bosonderzoek Ministerie van Landbouw, Natuur en Voedselkwaliteit |
|
Status of birds of the Bird Directive in the Scheldt estuary |
Bestand
|
Instituut voor Natuur- en Bosonderzoek Ministerie van Landbouw, Natuur en Voedselkwaliteit |
|
Numbers and breeding success of coastal breeding birds in the Scheldt estuary |
Bestand
|
Threat to biodiversity
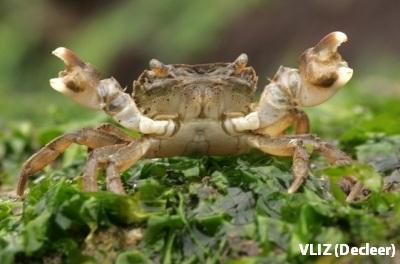
The increasing cargo transport and passenger traffic over large distances cause more non-endemic species to settle in new habitats. The Scheldt estuary, where ports, shipping and transport are of special interest, does not escape this trend either. The total number of registered non-edemic species with established populations in and around the Scheldt estuary is 83 (sitatuation in 2009). Nine of these species are provisionally considered as 'potentially invasive'. The brackish water zone appears to be particularly sensitive to the establishment of new non-endemic species.
| MEASUREMENT | TECHNICAL SHEET | DATA PROVIDER |
|---|---|---|
|
Number of non endemic species in the salty, brackish and/or fresh water salinity zone of the Scheldt estuary |
Bestand
|
Instituut voor Natuur- en Bosonderzoek VLIZ Alien Species Consortium |
Protection and development of nature reserves
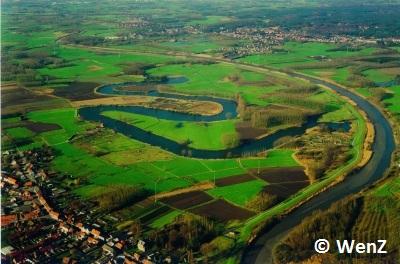
In the past 70 years, the area of valuable, legally protected nature reserves and landscapes in the Scheldt estuary has known an exponential increase from 167 ha in 1939 to 92,588 ha protected area in 2009. In the context of the updated Sigmaplan, more than 5,300 ha of new nature reserve will be developed along the Sea Scheldt valley by 2025.
| MEASUREMENT | TECHNICAL SHEET | DATA PROVIDER |
|---|---|---|
|
Nature development in the context of the Flemish 'Sigmaplan' and the Dutch 'Natuurpakket Westerschelde' |
|
Provincie Zeeland Waterwegen en Zeekanaal NV |
|
Area of national and international legally/statutory protected area in the Scheldt estuary |
Bestand
|
Agentschap Ruimtelijke Ordening-Onroerend Erfgoed Vlaanderen Agentschap voor Natuur en Bos Dienst Landelijk Gebied Instituut voor Natuur- en Bosonderzoek Ministerie van Landbouw, Natuur en Voedselkwaliteit Ministerie van Volkshuisvesting, Ruimtelijke Ordening en Milieubeheer Provincie Zeeland |
Opportunities for nature
The government, companies and society work together on new 'opportunities for nature' in the Scheldt estuary. Significant progression has been made in terms of water purification and the European standards for purification efficiency for nitrogen and phosphorus are amply achieved, both in the Netherlands and Flanders. Considering the limited range and growth prospects in organic farming, measures in the agricultural sector in the Scheldt river basin district are strongly focusing on diminishing the infiltration of eutrophying compounds into surface waters. In years with 'wet winters', it remains challenging - despite the globally downward trend - to keep the nitrate concentrations below the treshold value of 50mg NO3/L. Important common objectives have also been set for restoring fish migration in the Scheldt. In 2009, 3 out of 50 (or 6%) of the bottlenecks for fish migration in the estuary were removed. This means however that the objective (of the Benelux) of 1996 is still far beyond reach.
| MEASUREMENT | TECHNICAL SHEET | DATA PROVIDER |
|---|---|---|
|
Elimination of the bottle necks for fish migration in the Scheldt estuary |
Bestand
|
Sportvisserij Nederland Vlaamse milieumaatschappij Waterschap Zeeuwse Eilanden Waterschap Zeeuws-Vlaanderen |
|
Water treatment policy |
Not available | Centraal Bureau voor de Statistiek Vlaamse milieumaatschappij |
| Organic farming | Not available | Departement Landbouw en Visserij Stichting SKAL |
Fishery
Professional fishing in the Scheldt estuary only occurs in the Western Scheldt. In the Lower and Upper Sea Scheldt professional fishing no longer occurs. Concerning cockle fishing, always more than 50% of the total amount of harvestable cockle meat was fished between 1992 and 1995. Subsequently, there was a sharp decline in this percentage and in the period 2006 - 2010 no more cockle weres harvested. 1998 and 2004 were good years for cockles in the Western Scheldt with a total quantity of respectively 3.59 and 3.43 million kilograms 'harvestable' cockle meat. In 2009, only two (haddock and plaice) of the seven most important commercial fish stocks in the North Sea and adjacent areas were within biologically safe reference values. No area specific assessment is available for the Scheldt estuary. Sport fishing occurs across the entire estuary, but data on the pressure of this type of fishing are not available.
| METASUREMENT | TECHNICAL SHEET | DATA PROVIDER |
|---|---|---|
|
Pressure of fishing |
Bestand
|
Wageningen IMARES |
|
Commercial fish stocks within safe reference values |
Bestand
|
Internationale Raad voor het Onderzoek van de Zee |
Social response and collaboration
The Working Group Research and Monitoring is a permanent working group of the Vlaams Nederlandse Scheldecommissie (VNSC). Among other things, this committee also implements the Hague Memorandum (2005), in which a 'long term monitoring and research program to support cross-border cooperation for the policy and management of the Scheld estuary' was included. De ScheldeMonitor is a Flemish-Dutch knowledge and information system for research and monitoring in the Scheldt estuary. Within a period of ten years, the annual proportion of 'joint' Flemish-Dutch publications about the Scheldt estuary has risen from 18% (2000) to 54% (2010). This measurement includes publications that are included and described in ScheldeMonitor and of which the origin of the authors is known as well. On average, annually 25% of these publications are the result of a cross-border collaboration.
| MEASUREMENT | TECHNICAL SHEET | DATA PROVIDER |
|---|---|---|
|
Cross-border and cross-sectoral collaboration |
Not available | ScheldeMonitor (Vlaams Instituut voor de Zee) |
Use of the instrument Scheldt Indicators
The Scheldt Indicators can only fully come into their own if they are supported by a broad social basis. The user statistics of the Scheldt Indicators website show to what extent the target audience has found access to this instrument. The analysis of the user statistics serves as an indirect way of consulting the users and is used to manage the content and concept of the Scheldt Indicators. Furthermore, the analysis of these statistics can also be used to evaluate the communication strategy applied and to adjust this if necessary. The data supporting this indicator were only available several months after launching the Scheldt Indicators website, when a sufficiently long time series of user statistics were available.
| MEASUREMENT | TECHNICAL SHEET | DATA PROVIDER |
|---|---|---|
| Use of the instrument Scheldt Indicators | Not available | Vlaams Instituut voor de Zee |